Nowadays, it is very easy to find «espectacular» indicators that promise you an unbelievable returns in your trading. Some time ago I found a post about a promising indicator: How to use the IBS indicator. As he pointed out, «the IBS indicator is one of the best mean reversion indicators that actually carries significant predictive power». I really believe in mean reversion in markets, so I wanted to give it a try and test it personally, as I have done previously with some trading strategies in previous posts, like the VIX strategy.
In the article, Billerikay carried out analysis over a basket of global equity ETFs to show the prominent mean reversion property of global equity; he also also included a possible trading strategy that exploits this property in the QQQ ETF. The rules for the IBS trading strategy are very simple:
IBS = (close – low)/ (high – low)
- if IBS < 0.25 Buy on the Close
- if IBS > 0.75 Sell on the Close
In the post, the IBS indicator strategy is tested in the QQQ Etf from 2004 to 2020, where he get an impressive 9.12% annual return and 64% win ratio. With those numbers I wanted to test the IBS strategy by myself in other indexes to double check the strategy and to be sure it wasn’t that he had fitted the perfect strategy for the perfect index and the perfect time frame.
To do so, I have done a simple testing in Python. You can get the python code from my github account.
When we run the IBS indicator strategy on QQQ Etf for the last 20 years we get a stunning 12,94% annual return versus a 9,89% return for the QQQ Etf; it also reduces the drawdown and increase the Sharpe ratio to 0,79. Moreover, if we apply it to the S&P 500 using the SPY Etf we also beat the index with a 9,71% annual return versus 7,32 return of the index.
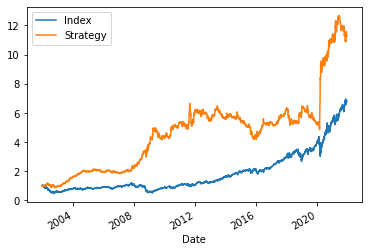
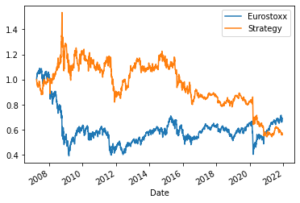
However, we can see that most of the overperformance of the IBS indicator strategy has occurred during big drawdowns in the index; the IBS indicator strategy is underperforming the index always apart from the 2008-2009 GFC and the 2020 Covid-19 bera market. On top of that, this IBS indicator strategy does not work at all in any of main European markets or in the US markets for the last 10 years.
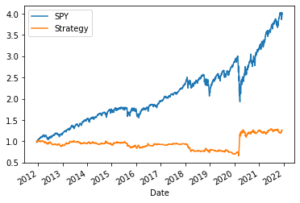
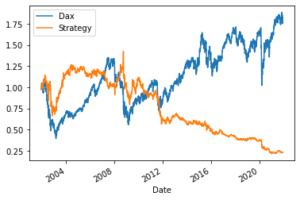
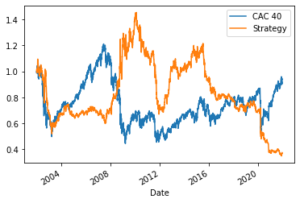
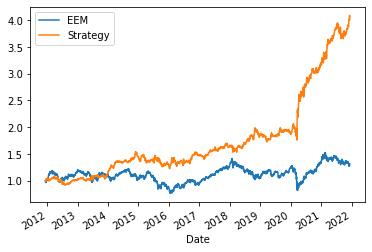
The only market where it has worked perfectly during the last 20 and 10 years has been applying the IBS indicator strategy on the emerging markets Etf EEM. The IBS indicator strategy has achieved a 15,08% annual return with a Sharpe Ratio of 1,64 for the last ten years.
Anyone can find any reason why this disparity in the performance for different regions? I will appreciate some comments.
Thanks

