Let’s going to have a deeper look at the Ibex Strategy we talked about in the previous post back in November last year. Remember the rules:
- We are going to use the Spanish Index Ibex 35
- Calculate the z-score for different periods (week, fortnight)
- we set a Z-target greater or equal than 1, since we know that 68% of every standard normal distribution is between -1 and 1.
- We are always long or short. Buying means closing short position and open a new long position, and vice versa.
- Buy at close of the daily bar when z-score crosses downward through the negative Z-target.
- Sell at close of the daily bar when z-score crosses upward through the positive Z-target.
- We are long or short one contract each day.
- Commissions are not taken into account.
The questions I want to answer here is: Does it work better when going long or short? Does it work better in a bull market or bear market? To answer those questions we are going to calculate some statistics depending on we are trading long or short, or if the Spanish Ibex 35 is above or below the 200 days moving average (in order to determine if we are in a bull or bear market).
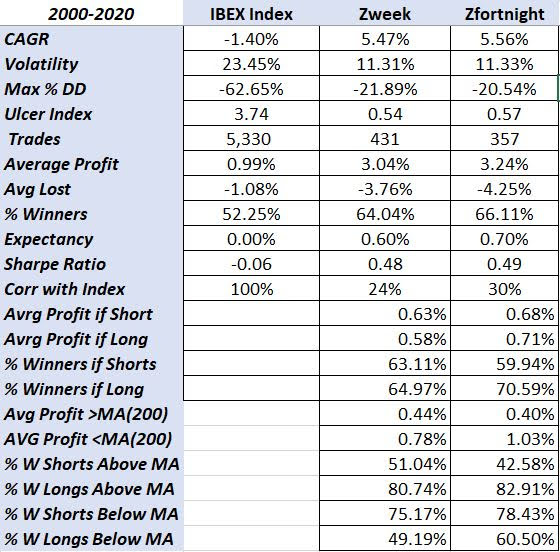
As we can see in the above table, there some interesting statistics we can use in order to improve the expected outcome of this strategy in the future:
- Both periods show better return in bear markets than in bull markets, but this is especially more significant the the Zfortnight strategy with more than double the average return per trade when the index is below the 200 days moving average than when the index is above the 200 days moving average.
- Moreover, the average of winner trades are more than 80% when going long in a bull market than going short. However, this difference is not as big when the index is below the 200 days moving average.
Therefore, next step could be to study a «meta-strategy» that accommodates the position sizing depending on if the index is above or below the 200 days moving average and whether the signal has been long or short. In other words, there is an option to apply a better money management to improve the odds of the strategy being even more profitable.